Low-Earth orbit
JPSS
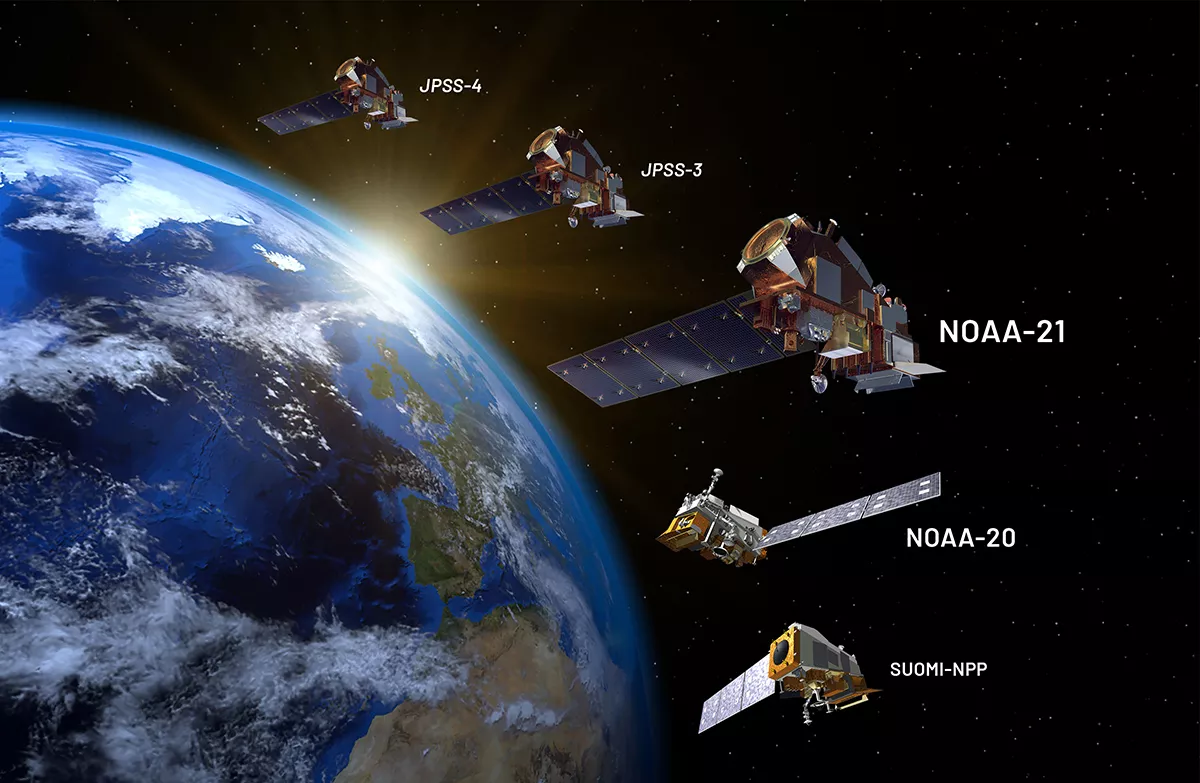
The Joint Polar Satellite System (JPSS) is NOAA’s low-earth orbitting satellite program. JPSS satellites circle the Earth from pole to pole and cross the equator about 14 times a day in the afternoon orbit to provide full global coverage twice a day. JPSS data is very important for numerical weather forecasting in the U.S. and deliver critical observations during severe weather events like hurricanes and blizzards. JPSS consists of 5 satellites:
Suomi NPP
NOAA 20
NOAA 21
JPSS 3 (will be NOAA 22)
JPSS 4 (will be NOAA 23)
Each satellite has a VIS/IR imager (VIIRS), an IR sounder (CrIS), a microwave sounder (ATMS), and an ozone mapper (OMPS).
The bubble chart below lists the different products from JPSS instruments. SDRs are Level-1b reprocessed Sensor Data Records. The SDRs are used as input to produce numerous Environmental Data Record (EDRs), which can be considered “Level-2” products. Most users shouldn’t ever have to look at Raw Data Records (RDRs), which are the raw Level-1 data. The figure is courtesy of Amy Huff and Rebekah Esmaili (see https://github.com/jpss-nodd/python-scripts).

VIIRS
The Visible Infrared Imaging Radiometer Suite, VIIRS, is a scanning radiometer with 5 high-resolution Imagery bands (or I-bands), 16 Moderate resolution bands (M-bands) and a Day/Night band (DNB). The JPSS satellites are in the same orbital plane as NASA’s A-Train constellation but at a higher altitude (JPSS altitude is about 824 km). The JPSS satellites are sun synchronous with an equator crossing time of 1330 (local time).
A rotating mirror reflects radiation onto a set of CCD detectors; a single scan relates to a rotation of the mirror. A single VIIRS scan is completed in 1.779 seconds - the mirror rotation rate is slightly faster than the spec but is within tolerance. The M bands and the day/night band have 16 detectors per scan (750 m spatial resolution per pixel), while the I bands have 32 detectors per scan (375 m resolution per pixel).
VIIRS has a swath of about 3040 km in the cross-track direction, while MODIS has a swath width of 2330 km. With VIIRS, there are no coverage gaps in the Tropics as there are with MODIS.
This table helps summarize the VIIRS channels.
Band Number |
Central Wavelength |
Nadir Resolution |
Gain |
|---|---|---|---|
I-1 |
0.640 µm |
375 m |
single |
I-2 |
0.865 µm |
375 m |
single |
I-3 |
1.61 µm |
375 m |
single |
I-4 |
3.74 µm |
375 m |
single |
I-5 |
11.45 µm |
375 m |
single |
M-1 |
0.412 µm |
750 m |
dual |
M-2 |
0.445 µm |
750 m |
dual |
M-3 |
0.488 µm |
750 m |
dual |
M-4 |
0.555 µm |
750 m |
dual |
M-5 |
0.672 µm |
750 m |
dual |
M-6 |
0.746 µm |
750 m |
single |
M-7 |
0.865 µm |
750 m |
dual |
M-8 |
1.24 µm |
750 m |
single |
M-9 |
1.38 µm |
750 m |
single |
M-10 |
1.61 µm |
750 m |
single |
M-11 |
2.25 µm |
750 m |
single |
M-12 |
3.70 µm |
750 m |
single |
M-13 |
4.05 µm |
750 m |
dual |
M-14 |
8.55 µm |
750 m |
single |
M-15 |
10.76 µm |
750 m |
single |
M-16 |
12.01 µm |
750 m |
single |
DNB |
0.7 µm |
500 m |
multiple |
Geolocation files
Geolocation files are produced separately. Here are their codes:
I-band SDR geolocation files
GIMGO: projected onto smooth ellipsoid (WGS84 ellipsoid)
GITCO: parallax-corrected for terrain
M-band SDR geolocation files
GMODO: projected onto smooth ellipsoid
GMTCO: parallax-corrected for terrain
Day/Night Band geolocation file
GDNBO: projected onto smooth ellipsoid
EDR geolocation files (use ground-track Mercator projection)
GIGTO: I-band EDR geolocation
GMGTO: M-band EDR geolocation
GNCCO: Day/Night Band EDR (NCC) geolocation
See also
Data Viewing
Data Access
-
Can search by dataset, time, and location
University of Wisconsin SIPS
Notebooks
Check out the notebook below for an example on how to process and visualize VIIRS data (source notebook).
See also
https://github.com/jpss-nodd/python-scripts
For downloading and visualizing JPSS VIIRS data
CrIS
The Cross-track Infrared Sounder, CrIS, is a Fourier Transform Spectrometer that provides high-resolution, three-dimensional temperature, pressure, and moisture profiles. These soundings are used to enhance weather forecasts and to support the monitoring of climate and environmental conditions. CrIS measures infrared radiation emitted by the Earth’s surface and atmosphere.
CrIS works in conjunction with the Advanced Technology Microwave Sounder (ATMS) to provide soundings in both clear and cloudy conditions. It scans in a step-scan fashion, observing a 3x3 array of Fields of View (FOVs) at each step. Each individual FOV has a nadir resolution of approximately 14 km. The full array is called a Field of Regard (FOR) and covers an area of roughly 50 km x 50 km. The instrument has a swath width of about 2200 km, achieving full global coverage in approximately 12 hours.
The CrIS instrument has 2211 spectral channels across three bands:
Band |
Spectral Range |
Number of Channels |
|---|---|---|
Long-wave IR (LWIR) |
650 - 1095 cm^-1 (9.14 - 15.38 µm) |
713 |
Mid-wave IR (MWIR) |
1210 - 1750 cm^-1 (5.71 - 8.26 µm) |
865 |
Short-wave IR (SWIR) |
2155 - 2550 $cm^{-1}$ (3.92 - 4.64 µm) |
633 |
See also
Data Access
ATMS
The Advanced Technology Microwave Sounder, ATMS, is a cross-track scanning microwave sounder that provides atmospheric temperature and moisture profiles. A key advantage of microwave sounding is its ability to penetrate clouds, providing valuable data in all weather conditions. ATMS data is crucial for numerical weather prediction models and is used in synergy with the infrared observations from CrIS.
ATMS has 22 microwave channels spanning a frequency range from 23 GHz to 183 GHz. These channels are strategically placed to measure different atmospheric properties. The lower-frequency channels provide information on surface temperature and emissivity, while channels around the 50-60 GHz oxygen absorption band provide temperature profiles. Channels around the 183 GHz water vapor absorption line provide moisture profiles.
The spatial resolution of ATMS varies with frequency. Higher-frequency channels have a nadir resolution of 15.8 km, while lower-frequency channels have a resolution of up to 74.8 km. The instrument has a wide swath of approximately 2600 km, ensuring global coverage.
Channel |
Frequency (GHz) |
Primary Purpose |
|---|---|---|
1 |
23.8 |
Water Vapor Burden |
2 |
31.4 |
Water Vapor Burden |
3 |
50.3 |
Surface Emissivity, Precipitation |
4 |
51.76 |
Temperature Sounding (Low Trop) |
5 |
52.8 |
Temperature Sounding (Low Trop) |
6 |
53.596±0.115 |
Temperature Sounding (Mid Trop) |
7 |
54.4 |
Temperature Sounding (Mid Trop) |
8 |
54.94 |
Temperature Sounding (Upper Trop) |
9 |
55.5 |
Temperature Sounding (Tropopause) |
10 |
57.29 |
Temperature Sounding (Strat) |
11 |
57.29±0.217 |
Temperature Sounding (Strat) |
12 |
57.29±0.322±0.048 |
Temperature Sounding (Strat) |
13 |
57.29±0.322±0.022 |
Temperature Sounding (Strat) |
14 |
57.29±0.322±0.010 |
Temperature Sounding (Strat) |
15 |
57.29±0.322±0.0045 |
Temperature Sounding (Strat) |
16 |
88.2 |
Clouds / Snow |
17 |
183.31±7.0 |
Water Vapor Sounding (Low Trop) |
18 |
183.31±7.0 |
Water Vapor Sounding (Low Trop) |
19 |
183.31±4.5 |
Water Vapor Sounding (Mid Trop) |
20 |
183.31±3.0 |
Water Vapor Sounding (Mid Trop) |
21 |
183.31±1.8 |
Water Vapor Sounding (Mid Trop) |
22 |
183.31±1.0 |
Water Vapor Sounding (Mid Trop) |
Here are the weighting functions for the 22 ATMS channels.

See also
Data Access
Data Viewing
NUCAPS
NUCAPS, the NOAA Unique Combined Atmospheric Processing System, is not a sensor itself, but rather a sophisticated retrieval algorithm that produces Environmental Data Records (EDRs). It uses radiances from both the CrIS and ATMS instruments to create high-resolution profiles of temperature, moisture, and important trace gases such as ozone ($O_3$), carbon monoxide ($CO$), and methane ($CH_4$).
The primary advantage of NUCAPS is its ability to combine the high spectral resolution of the CrIS infrared sounder with the cloud-penetrating capability of the ATMS microwave sounder. This allows NUCAPS to generate accurate atmospheric soundings in up to 80% cloud cover, providing a more complete picture of the atmosphere than either instrument could alone. These “all-weather” soundings are critical for weather forecasting, particularly for identifying atmospheric instability that can lead to severe weather.
The NUCAPS product suite provides vertical profiles at the spatial resolution of the CrIS Field of Regard (FOR), which is approximately 50 km at nadir and 135 km at the limb. These soundings are widely used by operational weather forecasters in tools like AWIPS to assess the pre-convective environment.
See also
Data Viewing
Data Access
MetOp
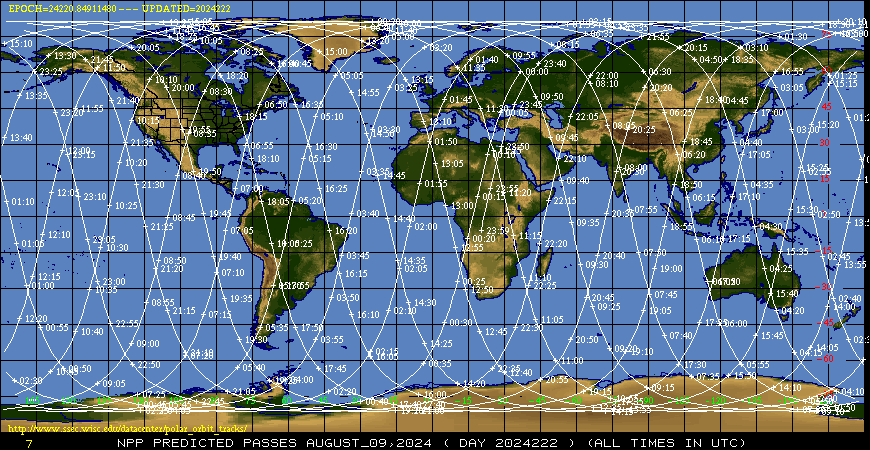
Oribt tracks
The University of Wisconsin – Madison Space Science and Engineering Center provides a resource to see historical and future tracks (next few days) for many polar-orbitting satellites.