![]()
MTG Lightning Imager data visualization
Lightning is a frequent hazard for most locations of the world. Its detection and observation is important for public safety and meteorological research.
According to EUMETSAT, “Lightning is a source of different types of signals in the electromagnetic spectrum. In detail: Very High Frequency signals (VHF), Very Low Frequency signals (VLF), Low Frequency signals (LF), and finally optical pulses. These signals can be detected by different type of instruments and can be employed for the location in space and time of lightning, as well as for their physical characterisation. Different instruments are capable of detecting either a part of or all the lightning categories listed above.”
The Meteosat Third Generation (MTG) Lightning Imager (LI) detects the optical pulses of lightning. One advantage of spaceborne lightning imagers is that they often have a more uniform field of view and (to some extent) detection efficiency over much of that field of view. However, they cannot directly discern in-cloud lightning vs. cloud-to-ground lightning like many ground-based networks are able to.
This notebook shows how to visualize point data from MTG-LI. It is largely based off this Medium article with some modifications and bug-fixing.
Install libraries
[2]:
!pip install satpy xarray h5py pandas matplotlib eumdac requests cartopy netCDF4
Collecting satpy
  Downloading satpy-0.53.0-py3-none-any.whl.metadata (11 kB)
Requirement already satisfied: xarray in /usr/local/lib/python3.10/dist-packages (2024.10.0)
Requirement already satisfied: h5py in /usr/local/lib/python3.10/dist-packages (3.12.1)
Requirement already satisfied: pandas in /usr/local/lib/python3.10/dist-packages (2.2.2)
Requirement already satisfied: matplotlib in /usr/local/lib/python3.10/dist-packages (3.8.0)
Collecting eumdac
  Downloading eumdac-2.2.3-py3-none-any.whl.metadata (5.2 kB)
Requirement already satisfied: requests in /usr/local/lib/python3.10/dist-packages (2.32.3)
Collecting cartopy
  Downloading Cartopy-0.24.1-cp310-cp310-manylinux_2_17_x86_64.manylinux2014_x86_64.whl.metadata (7.9 kB)
Collecting netCDF4
  Downloading netCDF4-1.7.2-cp310-cp310-manylinux_2_17_x86_64.manylinux2014_x86_64.whl.metadata (1.8 kB)
Requirement already satisfied: dask>=0.17.1 in /usr/local/lib/python3.10/dist-packages (from dask[array]>=0.17.1->satpy) (2024.10.0)
Collecting donfig (from satpy)
  Downloading donfig-0.8.1.post1-py3-none-any.whl.metadata (5.0 kB)
Requirement already satisfied: numpy>=1.21 in /usr/local/lib/python3.10/dist-packages (from satpy) (1.26.4)
Requirement already satisfied: packaging in /usr/local/lib/python3.10/dist-packages (from satpy) (24.1)
Requirement already satisfied: pillow in /usr/local/lib/python3.10/dist-packages (from satpy) (10.4.0)
Requirement already satisfied: platformdirs in /usr/local/lib/python3.10/dist-packages (from satpy) (4.3.6)
Requirement already satisfied: pooch in /usr/local/lib/python3.10/dist-packages (from satpy) (1.8.2)
Collecting pykdtree (from satpy)
  Downloading pykdtree-1.3.13-cp310-cp310-manylinux_2_17_x86_64.manylinux2014_x86_64.whl.metadata (8.6 kB)
Collecting pyorbital (from satpy)
  Downloading pyorbital-1.8.3.tar.gz (83 kB)
     ━━━━━━━━━━━━━━━━━━━━━━━━━━━━━━━━━━━━━━━━ 83.6/83.6 kB 3.3 MB/s eta 0:00:00
  Preparing metadata (setup.py) ... done
Requirement already satisfied: pyproj>=2.2 in /usr/local/lib/python3.10/dist-packages (from satpy) (3.7.0)
Collecting pyresample>=1.24.0 (from satpy)
  Downloading pyresample-1.31.0-cp310-cp310-manylinux_2_17_x86_64.manylinux2014_x86_64.whl.metadata (4.7 kB)
Requirement already satisfied: pyyaml>=5.1 in /usr/local/lib/python3.10/dist-packages (from satpy) (6.0.2)
Collecting trollimage>=1.24 (from satpy)
  Downloading trollimage-1.26.0-cp310-cp310-manylinux_2_17_x86_64.manylinux2014_x86_64.whl.metadata (1.6 kB)
Collecting trollsift (from satpy)
  Downloading trollsift-0.5.1.tar.gz (47 kB)
     ━━━━━━━━━━━━━━━━━━━━━━━━━━━━━━━━━━━━━━━━ 47.7/47.7 kB 2.9 MB/s eta 0:00:00
  Preparing metadata (setup.py) ... done
Collecting zarr (from satpy)
  Downloading zarr-2.18.3-py3-none-any.whl.metadata (5.7 kB)
Requirement already satisfied: python-dateutil>=2.8.2 in /usr/local/lib/python3.10/dist-packages (from pandas) (2.8.2)
Requirement already satisfied: pytz>=2020.1 in /usr/local/lib/python3.10/dist-packages (from pandas) (2024.2)
Requirement already satisfied: tzdata>=2022.7 in /usr/local/lib/python3.10/dist-packages (from pandas) (2024.2)
Requirement already satisfied: contourpy>=1.0.1 in /usr/local/lib/python3.10/dist-packages (from matplotlib) (1.3.0)
Requirement already satisfied: cycler>=0.10 in /usr/local/lib/python3.10/dist-packages (from matplotlib) (0.12.1)
Requirement already satisfied: fonttools>=4.22.0 in /usr/local/lib/python3.10/dist-packages (from matplotlib) (4.54.1)
Requirement already satisfied: kiwisolver>=1.0.1 in /usr/local/lib/python3.10/dist-packages (from matplotlib) (1.4.7)
Requirement already satisfied: pyparsing>=2.3.1 in /usr/local/lib/python3.10/dist-packages (from matplotlib) (3.2.0)
Requirement already satisfied: urllib3 in /usr/local/lib/python3.10/dist-packages (from eumdac) (2.2.3)
Requirement already satisfied: charset-normalizer<4,>=2 in /usr/local/lib/python3.10/dist-packages (from requests) (3.4.0)
Requirement already satisfied: idna<4,>=2.5 in /usr/local/lib/python3.10/dist-packages (from requests) (3.10)
Requirement already satisfied: certifi>=2017.4.17 in /usr/local/lib/python3.10/dist-packages (from requests) (2024.8.30)
Requirement already satisfied: shapely>=1.8 in /usr/local/lib/python3.10/dist-packages (from cartopy) (2.0.6)
Requirement already satisfied: pyshp>=2.3 in /usr/local/lib/python3.10/dist-packages (from cartopy) (2.3.1)
Collecting cftime (from netCDF4)
  Downloading cftime-1.6.4.post1-cp310-cp310-manylinux_2_17_x86_64.manylinux2014_x86_64.whl.metadata (8.7 kB)
Requirement already satisfied: click>=8.1 in /usr/local/lib/python3.10/dist-packages (from dask>=0.17.1->dask[array]>=0.17.1->satpy) (8.1.7)
Requirement already satisfied: cloudpickle>=3.0.0 in /usr/local/lib/python3.10/dist-packages (from dask>=0.17.1->dask[array]>=0.17.1->satpy) (3.1.0)
Requirement already satisfied: fsspec>=2021.09.0 in /usr/local/lib/python3.10/dist-packages (from dask>=0.17.1->dask[array]>=0.17.1->satpy) (2024.10.0)
Requirement already satisfied: partd>=1.4.0 in /usr/local/lib/python3.10/dist-packages (from dask>=0.17.1->dask[array]>=0.17.1->satpy) (1.4.2)
Requirement already satisfied: toolz>=0.10.0 in /usr/local/lib/python3.10/dist-packages (from dask>=0.17.1->dask[array]>=0.17.1->satpy) (0.12.1)
Requirement already satisfied: importlib-metadata>=4.13.0 in /usr/local/lib/python3.10/dist-packages (from dask>=0.17.1->dask[array]>=0.17.1->satpy) (8.5.0)
Collecting configobj (from pyresample>=1.24.0->satpy)
  Downloading configobj-5.0.9.tar.gz (101 kB)
     ━━━━━━━━━━━━━━━━━━━━━━━━━━━━━━━━━━━━━━━━ 101.5/101.5 kB 7.8 MB/s eta 0:00:00
  Installing build dependencies ... done
  Getting requirements to build wheel ... done
  Preparing metadata (pyproject.toml) ... done
Requirement already satisfied: six>=1.5 in /usr/local/lib/python3.10/dist-packages (from python-dateutil>=2.8.2->pandas) (1.16.0)
Requirement already satisfied: scipy in /usr/local/lib/python3.10/dist-packages (from pyorbital->satpy) (1.13.1)
Collecting asciitree (from zarr->satpy)
  Downloading asciitree-0.3.3.tar.gz (4.0 kB)
  Preparing metadata (setup.py) ... done
Collecting numcodecs>=0.10.0 (from zarr->satpy)
  Downloading numcodecs-0.13.1-cp310-cp310-manylinux_2_17_x86_64.manylinux2014_x86_64.whl.metadata (2.9 kB)
Collecting fasteners (from zarr->satpy)
  Downloading fasteners-0.19-py3-none-any.whl.metadata (4.9 kB)
Requirement already satisfied: zipp>=3.20 in /usr/local/lib/python3.10/dist-packages (from importlib-metadata>=4.13.0->dask>=0.17.1->dask[array]>=0.17.1->satpy) (3.20.2)
Requirement already satisfied: locket in /usr/local/lib/python3.10/dist-packages (from partd>=1.4.0->dask>=0.17.1->dask[array]>=0.17.1->satpy) (1.0.0)
Downloading satpy-0.53.0-py3-none-any.whl (1.7 MB)
   ━━━━━━━━━━━━━━━━━━━━━━━━━━━━━━━━━━━━━━━━ 1.7/1.7 MB 28.8 MB/s eta 0:00:00
Downloading eumdac-2.2.3-py3-none-any.whl (67 kB)
   ━━━━━━━━━━━━━━━━━━━━━━━━━━━━━━━━━━━━━━━━ 67.9/67.9 kB 5.3 MB/s eta 0:00:00
Downloading Cartopy-0.24.1-cp310-cp310-manylinux_2_17_x86_64.manylinux2014_x86_64.whl (11.7 MB)
   ━━━━━━━━━━━━━━━━━━━━━━━━━━━━━━━━━━━━━━━━ 11.7/11.7 MB 89.0 MB/s eta 0:00:00
Downloading netCDF4-1.7.2-cp310-cp310-manylinux_2_17_x86_64.manylinux2014_x86_64.whl (9.1 MB)
   ━━━━━━━━━━━━━━━━━━━━━━━━━━━━━━━━━━━━━━━━ 9.1/9.1 MB 93.7 MB/s eta 0:00:00
Downloading pyresample-1.31.0-cp310-cp310-manylinux_2_17_x86_64.manylinux2014_x86_64.whl (4.4 MB)
   ━━━━━━━━━━━━━━━━━━━━━━━━━━━━━━━━━━━━━━━━ 4.4/4.4 MB 6.1 MB/s eta 0:00:00
Downloading pykdtree-1.3.13-cp310-cp310-manylinux_2_17_x86_64.manylinux2014_x86_64.whl (345 kB)
   ━━━━━━━━━━━━━━━━━━━━━━━━━━━━━━━━━━━━━━━━ 345.0/345.0 kB 23.5 MB/s eta 0:00:00
Downloading trollimage-1.26.0-cp310-cp310-manylinux_2_17_x86_64.manylinux2014_x86_64.whl (629 kB)
   ━━━━━━━━━━━━━━━━━━━━━━━━━━━━━━━━━━━━━━━━ 629.5/629.5 kB 33.9 MB/s eta 0:00:00
Downloading cftime-1.6.4.post1-cp310-cp310-manylinux_2_17_x86_64.manylinux2014_x86_64.whl (1.3 MB)
   ━━━━━━━━━━━━━━━━━━━━━━━━━━━━━━━━━━━━━━━━ 1.3/1.3 MB 53.3 MB/s eta 0:00:00
Downloading donfig-0.8.1.post1-py3-none-any.whl (21 kB)
Downloading zarr-2.18.3-py3-none-any.whl (210 kB)
   ━━━━━━━━━━━━━━━━━━━━━━━━━━━━━━━━━━━━━━━━ 210.7/210.7 kB 16.2 MB/s eta 0:00:00
Downloading numcodecs-0.13.1-cp310-cp310-manylinux_2_17_x86_64.manylinux2014_x86_64.whl (8.6 MB)
   ━━━━━━━━━━━━━━━━━━━━━━━━━━━━━━━━━━━━━━━━ 8.6/8.6 MB 56.8 MB/s eta 0:00:00
Downloading fasteners-0.19-py3-none-any.whl (18 kB)
Building wheels for collected packages: pyorbital, trollsift, asciitree, configobj
  Building wheel for pyorbital (setup.py) ... done
  Created wheel for pyorbital: filename=pyorbital-1.8.3-py2.py3-none-any.whl size=67999 sha256=d464b90065124a73655ab2d0347f0478e23106f10f43035870b89d36ecc55af5
  Stored in directory: /root/.cache/pip/wheels/18/0d/a4/172ebb57ee3a93d640473b9c165f8ae46391975976188aa10e
  Building wheel for trollsift (setup.py) ... done
  Created wheel for trollsift: filename=trollsift-0.5.1-py2.py3-none-any.whl size=22788 sha256=b7b0dd01778fd473242aa2b289484cd03c5dabe34987ffa216847732ef74b5ee
  Stored in directory: /root/.cache/pip/wheels/80/58/3b/9192ab25b89c1b414a6c298afff4abb583495cbd960bee077a
  Building wheel for asciitree (setup.py) ... done
  Created wheel for asciitree: filename=asciitree-0.3.3-py3-none-any.whl size=5034 sha256=2d5af6cb6b5fd54e033aa5b79e3292859b596e18d589d08fd4dc0d6b09e8fb2b
  Stored in directory: /root/.cache/pip/wheels/7f/4e/be/1171b40f43b918087657ec57cf3b81fa1a2e027d8755baa184
  Building wheel for configobj (pyproject.toml) ... done
  Created wheel for configobj: filename=configobj-5.0.9-py2.py3-none-any.whl size=35615 sha256=40c9599885e91301a30f87eb5fc65b07c36463f63e31564f136e2eef2acb2ea8
  Stored in directory: /root/.cache/pip/wheels/a1/6c/03/6c5e3cf1a6e4b9e2fc5c4409be4abc5a8268bd9c878739cb32
Successfully built pyorbital trollsift asciitree configobj
Installing collected packages: asciitree, trollsift, trollimage, pykdtree, numcodecs, fasteners, donfig, configobj, cftime, zarr, pyresample, pyorbital, netCDF4, eumdac, cartopy, satpy
Successfully installed asciitree-0.3.3 cartopy-0.24.1 cftime-1.6.4.post1 configobj-5.0.9 donfig-0.8.1.post1 eumdac-2.2.3 fasteners-0.19 netCDF4-1.7.2 numcodecs-0.13.1 pykdtree-1.3.13 pyorbital-1.8.3 pyresample-1.31.0 satpy-0.53.0 trollimage-1.26.0 trollsift-0.5.1 zarr-2.18.3
Set up eumdac keys
You need a EUMETSAT account and associated keys to run grab data. After creating an account, you can find your “consumer key” and “consumer secret” here: https://api.eumetsat.int/api-key/. Copy them and paste them into the code below.
[3]:
# Import EUMDAC and dependent libraries to begin
import eumdac
import datetime
import shutil
import requests

# Insert your personal key and secret into the single quotes
consumer_key = '<your-consumer-key>'
consumer_secret = '<your-consumer-secret>'

credentials = (consumer_key, consumer_secret)

token = eumdac.AccessToken(credentials)

print(f"This token '{token}' expires {token.expiration}")
This token '68832357-c141-3957-9561-a07aeec583c9' expires 2024-11-12 13:25:29.487269
Download data
Point-based LI data comes in 3 types — lightning events, flashes and groups. See here for more information. To download the flash data into directory point_data, run the following code:
[4]:
datastore = eumdac.DataStore(token)

import os
import zipfile
from io import BytesIO
from concurrent.futures import ThreadPoolExecutor, as_completed

# Assume datastore is already defined and connected
searchs = datastore.opensearch("""pi=EO:EUM:DAT:0691&dtstart=2024-07-30T22:00:00&dtend=2024-07-31T22:00:00""")

# Create the data directory if it doesn't exist
os.makedirs("point_data", exist_ok=True)

def download_and_extract(product):
    try:
        # Create a temporary BytesIO object to hold the downloaded zip file
        with product.open() as fsrc:
            with BytesIO(fsrc.read()) as bio:
                with zipfile.ZipFile(bio, 'r') as zip_ref:
                    # Check if all the files to be extracted already exist
                    all_files_exist = all(os.path.exists(os.path.join("point_data", name)) for name in zip_ref.namelist())
                    if all_files_exist:
                        print(f"All files already exist, skipping download for product: {product}")
                        return
                    # Extract all the contents into the data directory
                    zip_ref.extractall("point_data")
                    print(f'Extracted product finished.')
    except Exception as e:
        print(f"Failed to process product: {e}")

# Use ThreadPoolExecutor to handle concurrency
with ThreadPoolExecutor(max_workers=5) as executor:
    futures = {executor.submit(download_and_extract, product): product for product in searchs}
    for future in as_completed(futures):
        product = futures[future]
        try:
            future.result()
        except Exception as e:
            print(f"Exception occurred while processing product: {e}")

print("All products processed.")
Extracted product finished.
Extracted product finished.
Extracted product finished.
Extracted product finished.
Extracted product finished.
Extracted product finished.
Extracted product finished.
Extracted product finished.
Extracted product finished.
Extracted product finished.
Extracted product finished.
Extracted product finished.
Extracted product finished.
Extracted product finished.
Extracted product finished.
Extracted product finished.
Extracted product finished.
Extracted product finished.
Extracted product finished.
Extracted product finished.
Extracted product finished.
Extracted product finished.
Extracted product finished.
Extracted product finished.
Extracted product finished.
Extracted product finished.
Extracted product finished.
Extracted product finished.
Extracted product finished.
Extracted product finished.
Extracted product finished.
Extracted product finished.
Extracted product finished.
Extracted product finished.
Extracted product finished.
Extracted product finished.
Extracted product finished.
Extracted product finished.
Extracted product finished.
Extracted product finished.
Extracted product finished.
Extracted product finished.
Extracted product finished.
Extracted product finished.
Extracted product finished.
Extracted product finished.
Extracted product finished.
Extracted product finished.
Extracted product finished.
Extracted product finished.
Extracted product finished.
Extracted product finished.
Extracted product finished.
Extracted product finished.
Extracted product finished.
Extracted product finished.
Extracted product finished.
Extracted product finished.
Extracted product finished.
Extracted product finished.
Extracted product finished.
Extracted product finished.
Extracted product finished.
Extracted product finished.
Extracted product finished.
Extracted product finished.
Extracted product finished.
Extracted product finished.
Extracted product finished.
Extracted product finished.
Extracted product finished.
Extracted product finished.
Extracted product finished.
Extracted product finished.
Extracted product finished.
Extracted product finished.
Extracted product finished.
Extracted product finished.
Extracted product finished.
Extracted product finished.
Extracted product finished.
Extracted product finished.
Extracted product finished.
Extracted product finished.
Extracted product finished.
Extracted product finished.
Extracted product finished.
Extracted product finished.
Extracted product finished.
Extracted product finished.
Extracted product finished.
Extracted product finished.
Extracted product finished.
Extracted product finished.
Extracted product finished.
Extracted product finished.
Extracted product finished.
Extracted product finished.
Extracted product finished.
Extracted product finished.
Extracted product finished.
Extracted product finished.
Extracted product finished.
Extracted product finished.
Extracted product finished.
Extracted product finished.
Extracted product finished.
Extracted product finished.
Extracted product finished.
Extracted product finished.
Extracted product finished.
Extracted product finished.
Extracted product finished.
Extracted product finished.
Extracted product finished.
Extracted product finished.
Extracted product finished.
Extracted product finished.
Extracted product finished.
Extracted product finished.
Extracted product finished.
Extracted product finished.
Extracted product finished.
Extracted product finished.
Extracted product finished.
Extracted product finished.
Extracted product finished.
Extracted product finished.
Extracted product finished.
Extracted product finished.
Extracted product finished.
Extracted product finished.
Extracted product finished.
Extracted product finished.
Extracted product finished.
Extracted product finished.
Extracted product finished.
Extracted product finished.
Extracted product finished.
Extracted product finished.
Extracted product finished.
Extracted product finished.
Extracted product finished.
Extracted product finished.
Extracted product finished.
All products processed.
[5]:
!ls point_data | head
EOPMetadata.xml
manifest.xml
quicklooks
W_XX-EUMETSAT-Darmstadt,IMG+SAT,MTI1+LI-2-LFL--FD--CHK-BODY--ARC-NC4E_C_EUMT_20240730220016_L2PF_OPE_20240730215007_20240730220007_N__T_0132_0001.nc
W_XX-EUMETSAT-Darmstadt,IMG+SAT,MTI1+LI-2-LFL--FD--CHK-BODY--ARC-NC4E_C_EUMT_20240730221016_L2PF_OPE_20240730220007_20240730221007_N__T_0133_0001.nc
W_XX-EUMETSAT-Darmstadt,IMG+SAT,MTI1+LI-2-LFL--FD--CHK-BODY--ARC-NC4E_C_EUMT_20240730222016_L2PF_OPE_20240730221007_20240730222007_N__T_0134_0001.nc
W_XX-EUMETSAT-Darmstadt,IMG+SAT,MTI1+LI-2-LFL--FD--CHK-BODY--ARC-NC4E_C_EUMT_20240730223016_L2PF_OPE_20240730222007_20240730223007_N__T_0135_0001.nc
W_XX-EUMETSAT-Darmstadt,IMG+SAT,MTI1+LI-2-LFL--FD--CHK-BODY--ARC-NC4E_C_EUMT_20240730224016_L2PF_OPE_20240730223007_20240730224007_N__T_0136_0001.nc
W_XX-EUMETSAT-Darmstadt,IMG+SAT,MTI1+LI-2-LFL--FD--CHK-BODY--ARC-NC4E_C_EUMT_20240730225016_L2PF_OPE_20240730224007_20240730225007_N__T_0137_0001.nc
W_XX-EUMETSAT-Darmstadt,IMG+SAT,MTI1+LI-2-LFL--FD--CHK-BODY--ARC-NC4E_C_EUMT_20240730230016_L2PF_OPE_20240730225007_20240730230007_N__T_0138_0001.nc
Visualize the Data
Here, we use the Satpy library to load point data. We then convert to a xarray dataset and finally to a pandas.DataFrame with only the fields that we need.
N.B.: Sometimes we get an error on this block for unknown reasons (“HDF Error”). Executing the block again usually clears this up.
[1]:
from glob import glob
import os

import cartopy.crs as ccrs
import cartopy.feature as cfeature
import matplotlib.pyplot as plt
import numpy as np
import pandas as pd
import seaborn as sns
from satpy import Scene, MultiScene
import matplotlib.patheffects as path_effects

# We batch up the Scene creation due to RAM limitations in Colab
from datetime import datetime, timedelta


scn = Scene(filenames=glob(f"point_data/*001.nc"), reader="li_l2_nc",)
scn.load(scn.available_dataset_names())

ds = scn.to_xarray_dataset()

#This wasn't working...
#df = ds.to_dataframe()

# Get longitude and latitude from metadata
#df["lon"], df["lat"] = ds["number_of_events"].attrs["area"].get_lonlats()

lon, lat = ds["number_of_events"].attrs["area"].get_lonlats()
flash_times = ds["flash_time"].to_numpy()
radiance = ds["radiance"].to_numpy()

df = pd.DataFrame({'radiance':radiance, 'flash_time': flash_times, 'lon': lon, 'lat': lat})

# Drop columns that we will not need
#df = df.drop(columns=["flash_filter_confidence"])

# Drop null values (if any)
df.dropna(inplace=True)

# Convert flash_time to datetime
df["flash_time"] = pd.to_datetime(df["flash_time"])

print(df.head())
   radiance                    flash_time        lon     lat
0     270.0 2024-07-30 21:50:06.014499968 -62.972103 -1.6875
1      27.0 2024-07-30 21:50:08.016100096 -64.219505 -2.0115
2      19.0 2024-07-30 21:50:08.174100096 -67.124702 -0.7830
3     102.0 2024-07-30 21:50:09.224099968 -62.880302 -1.8090
4      19.0 2024-07-30 21:50:09.370099968 -65.321098 -2.7162
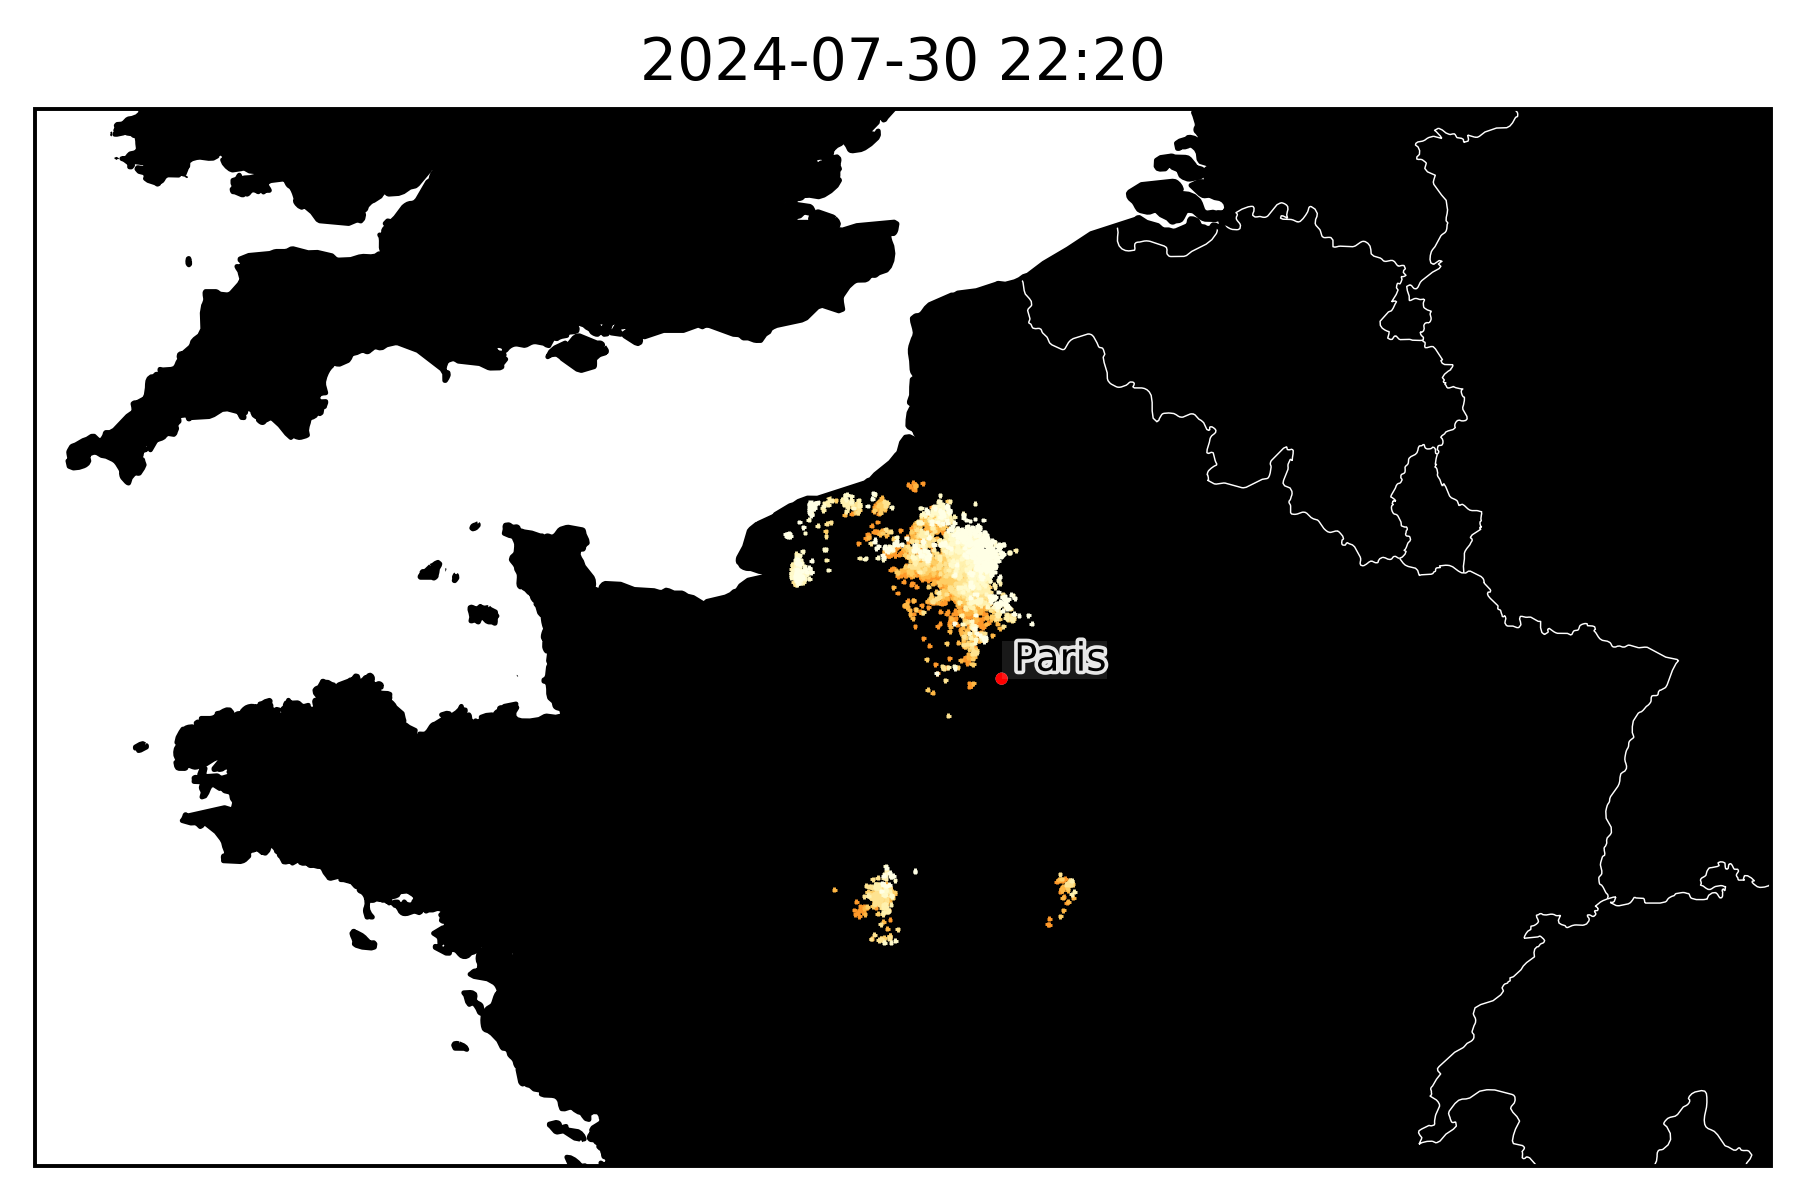
Creating lightning-age images
Now we create the PNGs for each aggregated 5 minutes by making a scatterplot. I short-circuit the loop and only do the first 6, but this may take 10 minutes or so if you want to do all of the pngs.
[10]:
# Create 5 min bins
df["bin_5min"] = df["flash_time"].dt.floor("5min")

# Define plot function
def plot_df(df, minute):
    # Define the map projection
    projection = ccrs.Mercator()
    crs = ccrs.PlateCarree()

    # Create a new figure with a high DPI for better resolution
    plt.figure(dpi=350)
    ax = plt.axes(projection=projection, frameon=True)

    # Set the geographical extent of the map (bounding box)
    # for northern France
    lon_min = -6
    lon_max = 9
    lat_min = 46
    lat_max = 52
    ax.set_extent([lon_min, lon_max, lat_min, lat_max])

    # Add land and border features to the map
    ax.add_feature(cfeature.LAND.with_scale("10m"), facecolor="black")
    ax.add_feature(cfeature.BORDERS.with_scale("10m"), lw=0.3, color="white")
    ax.coastlines()

    # Add Paris location with a small red dot and a label
    paris_lon, paris_lat = 2.3522, 48.8566
    txt = ax.plot(paris_lon, paris_lat, '.', color='red', markersize=3, transform=ccrs.PlateCarree(), zorder=6)
    # Add white outline to the red dot for better visibility
    txt[0].set_path_effects([path_effects.withStroke(linewidth=1, foreground="w", alpha=0.8)])

    # Add a text label for Paris with a white background and black outline
    text = ax.text(
        paris_lon, paris_lat, ' Paris', fontsize=8, alpha=1, ha='left', va='bottom',
        bbox=dict(facecolor='white', alpha=0.1, pad=0.0, edgecolor='none'),
        transform=ccrs.PlateCarree(), zorder=6
    )
    text.set_path_effects([path_effects.withStroke(linewidth=1.5, foreground="w", alpha=0.9)])

    # Plot the data points on the map using seaborn's scatterplot
    sns.scatterplot(
        x="lon",
        y="lat",
        data=df,
        edgecolor=None,
        transform=ccrs.PlateCarree(),
        hue="min_ago",
        palette="YlOrBr",
        s=1,
        ax=ax,
        marker="+",
        hue_norm=(0, 60),
        legend=False,
        linewidths=0.6
    )

    # Set the title of the plot with the current minute
    ax.set_title(f"{minute:%Y-%m-%d %H:%M}")
    # Save the plot as a PNG file in the specified directory
    plt.savefig(f"minute5_lightning/{minute:%Y-%m-%d__%H%M}.png", bbox_inches="tight")
    # Adjust layout to prevent clipping of elements
    plt.tight_layout()
    # Close the plot to free memory
    plt.close()


# Iterate over unique 5-minute intervals
os.makedirs("minute5_lightning", exist_ok=True)

for ii, minute in enumerate(df["bin_5min"].unique()):
    h1_ago = minute - pd.Timedelta(hours=1)
    h5_df = df[(df["bin_5min"] >= h1_ago) & (df["bin_5min"] <= minute)]
    h5_df["min_ago"] = (h5_df["bin_5min"].max() - h5_df["bin_5min"]).dt.seconds / 60
    plot_df(h5_df, minute)

    if ii == 6:
        break # short-circuiting image-creation to save time
<ipython-input-10-3b49e3cba650>:74: SettingWithCopyWarning:
A value is trying to be set on a copy of a slice from a DataFrame.
Try using .loc[row_indexer,col_indexer] = value instead

See the caveats in the documentation: https://pandas.pydata.org/pandas-docs/stable/user_guide/indexing.html#returning-a-view-versus-a-copy
  h5_df["min_ago"] = (h5_df["bin_5min"].max() - h5_df["bin_5min"]).dt.seconds / 60
/usr/local/lib/python3.10/dist-packages/cartopy/mpl/feature_artist.py:144: UserWarning: facecolor will have no effect as it has been defined as "never".
  warnings.warn('facecolor will have no effect as it has been '
[13]:
from IPython.display import Image
Image('minute5_lightning/2024-07-30__2220.png', width=800)
[13]:
Creating flash-count time series
[14]:
# Setting the index and creating the flash_count column in one step
df_orig = df.set_index('flash_time').assign(flash_count=1)

# Resampling to hourly sums
hourly_sums = df_orig['flash_count'].resample('h').sum().reset_index()

# Creating bar plot
plt.figure(figsize=(12, 6))
sns.barplot(x='flash_time', y='flash_count', data=hourly_sums, palette='viridis')
plt.xticks(rotation=45)
plt.title('Hourly Sums of Flash Counts')
plt.xlabel('Timestamp')
plt.ylabel('Sum of Flash Counts')
plt.show()
<ipython-input-14-0b019525db6a>:9: FutureWarning:

Passing `palette` without assigning `hue` is deprecated and will be removed in v0.14.0. Assign the `x` variable to `hue` and set `legend=False` for the same effect.

  sns.barplot(x='flash_time', y='flash_count', data=hourly_sums, palette='viridis')

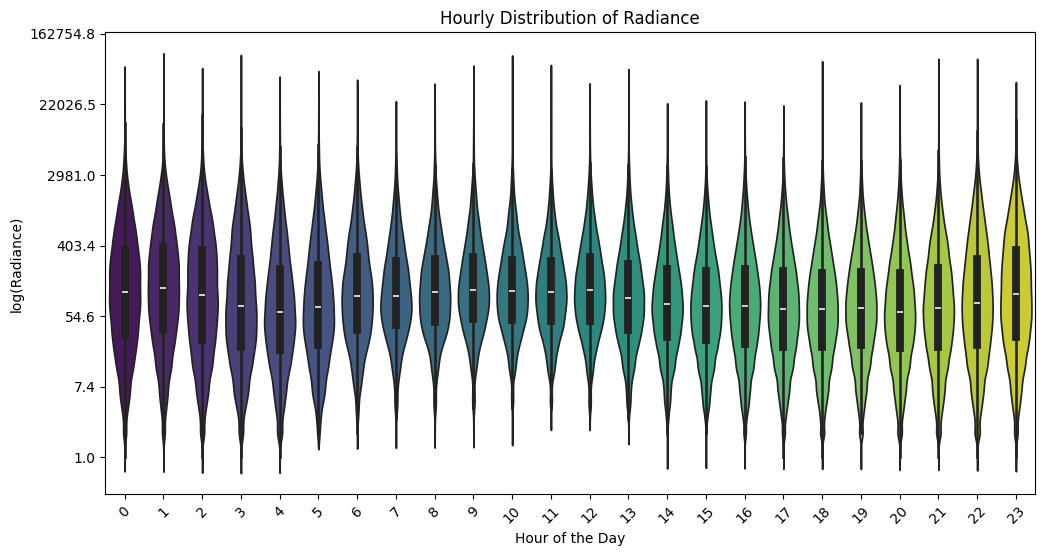
Creating radiance distribution time series
We can also make hourly distributions of radiance data.
[15]:
# Make 'hour' Series and log(radiance)
df['hour'] = df['flash_time'].dt.hour
df['log_radiance'] = np.log(df['radiance'])
[16]:
import matplotlib.ticker as ticker

# Creating violin plot of 'log_radiance' by hour
plt.figure(figsize=(12, 6))
sns.violinplot(x='hour', y='log_radiance', data=df, palette='viridis')

# Setting yticks to reflect the log scale
def log_format(x, pos):
    return f'{np.exp(x):.1f}'

plt.gca().yaxis.set_major_formatter(ticker.FuncFormatter(log_format))

plt.xticks(rotation=45)
plt.title('Hourly Distribution of Radiance')
plt.xlabel('Hour of the Day')
plt.ylabel('log(Radiance)')
plt.show()
<ipython-input-16-2cbd21614c64>:5: FutureWarning:

Passing `palette` without assigning `hue` is deprecated and will be removed in v0.14.0. Assign the `x` variable to `hue` and set `legend=False` for the same effect.

  sns.violinplot(x='hour', y='log_radiance', data=df, palette='viridis')
Creating spatiotemporal map of flashes
[38]:
# Define the map projection
#projection = ccrs.Mercator()
crs = ccrs.PlateCarree()

# Create a new figure with a high DPI for better resolution
plt.figure(dpi=350)
ax = plt.axes(projection=crs, frameon=True)

# Set the geographical extent of the map (bounding box)
# for northern France
lon_min = -15
lon_max = 30
lat_min = 35
lat_max = 62
ax.set_extent([lon_min, lon_max, lat_min, lat_max])

# Add land and border features to the map
ax.add_feature(cfeature.LAND.with_scale("10m"), facecolor="gray")
ax.add_feature(cfeature.BORDERS.with_scale("10m"), lw=0.3, color="white")
ax.coastlines()

# Seaborn
# Plot the data points on the map using seaborn's scatterplot
#axs = sns.scatterplot(
#        x="lon",
#        y="lat",
#        data=df,
#        edgecolor=None,
#        transform=ccrs.PlateCarree(),
#        hue="hour",
#        palette="rainbow",
#        s=1,
#        ax=ax,
#        marker="o",
#        hue_norm=(0, 23),
#        legend=False,
#        linewidths=0.6
#)

# Matplotlib
scat = plt.scatter(
          x=np.array(df["lon"]),
          y=np.array(df["lat"]),
          c=np.array(df["hour"]),
          s=2,
          cmap="rainbow",
          vmin=0,
          vmax=23,
          transform=crs
)

# Set the title of the plot with the current minute
ax.set_title("Hourly distribution of lighting flashes")

# Colorbar
plt.colorbar(orientation='vertical', label='Hour [UTC]', shrink=0.75)

# Adjust layout to prevent clipping of elements
plt.tight_layout()

plt.show()
/usr/local/lib/python3.10/dist-packages/cartopy/mpl/feature_artist.py:144: UserWarning: facecolor will have no effect as it has been defined as "never".
  warnings.warn('facecolor will have no effect as it has been '

[ ]: